- NengoLoihi
- How to Build a Brain
- Tutorials
- A Single Neuron Model
- Representing a scalar
- Representing a Vector
- Addition
- Arbitrary Linear Transformation
- Nonlinear Transformations
- Structured Representations
- Question Answering
- Question Answering with Control
- Question Answering with Memory
- Learning a communication channel
- Sequencing
- Routed Sequencing
- Routed Sequencing with Cleanup Memory
- Routed Sequencing with Cleanup all Memory
- 2D Decision Integrator
- Requirements
- License
- Tutorials
- NengoCore
- Ablating neurons
- Deep learning
A Single Neuron Model
All models in nengo are built inside “networks”. Inside a network, you can put more networks, and you can connect networks to each other. You can also put other objects such as neural populations or “ensembles” (which have individual neurons inside of them) inside the networks. For this model, you will make a network with one neuron.
[1]:
# Setup the environment
import numpy as np
import nengo
Create the Model
This model has parameters as described in the book, ensuring that it is an “on” neuron. The neuron will be slightly different each time you run this script, as many parameters are randomly chosen.
[2]:
# Create the network object to which we can add ensembles, connections, etc.
model = nengo.Network(label="A Single Neuron")

with model:
    # Input to drive the neuron
    stim = nengo.Node(lambda t: np.cos(16 * t))

    # Ensemble with one neuron
    neuron = nengo.Ensemble(
        1, dimensions=1, encoders=[[1]]  # Represent a scalar
    )  # Sets the neurons firing rate to increase for positive input

    # Connecting input to ensemble
    nengo.Connection(stim, neuron)
Run the Model
In order to run the model, import the nengo_gui visualizer as follows.
[ ]:
from nengo_gui.ipython import IPythonViz

IPythonViz(model, "ch1-singleneuron.py.cfg")
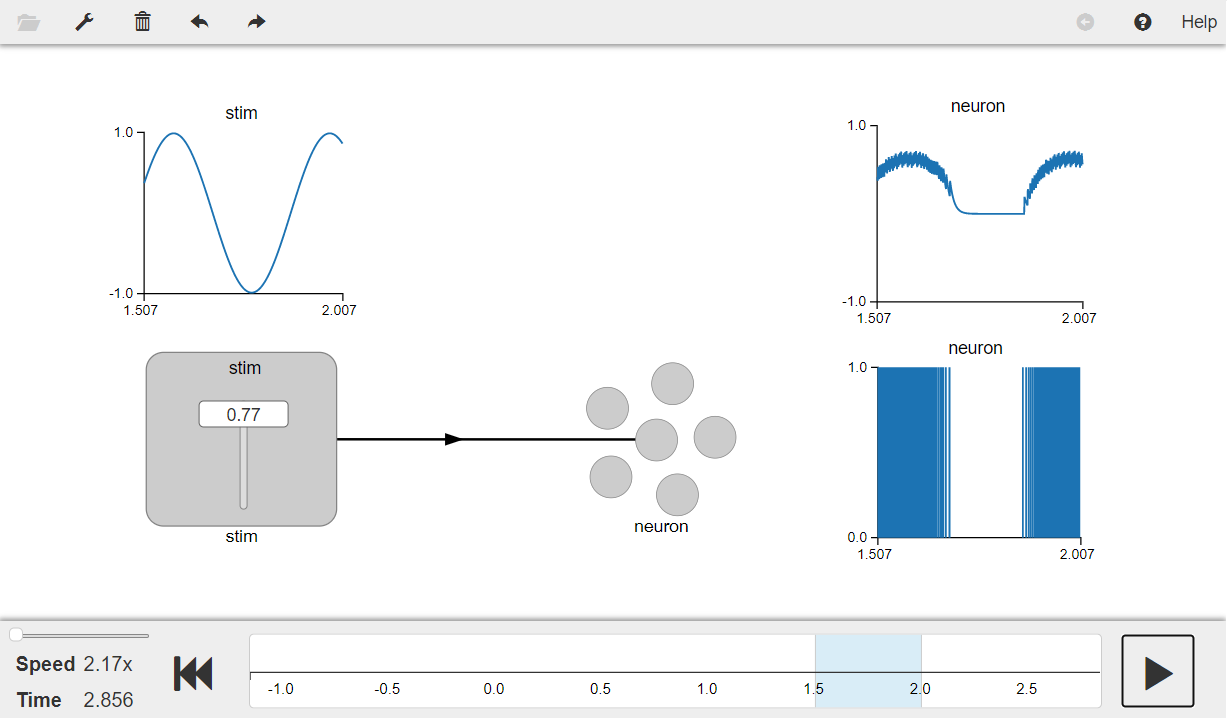
Press the play button in the visualizer to run the simulation. You should see the graphs as shown in the figure below.
The graph on the top left shows the input signal and the graph on the top right shows the value represented by the neuron. The filtered spikes from the neuron are shown in the graph on the bottom right.
[3]:
from IPython.display import Image

Image(filename="ch1-singleneuron.png")
[3]:
